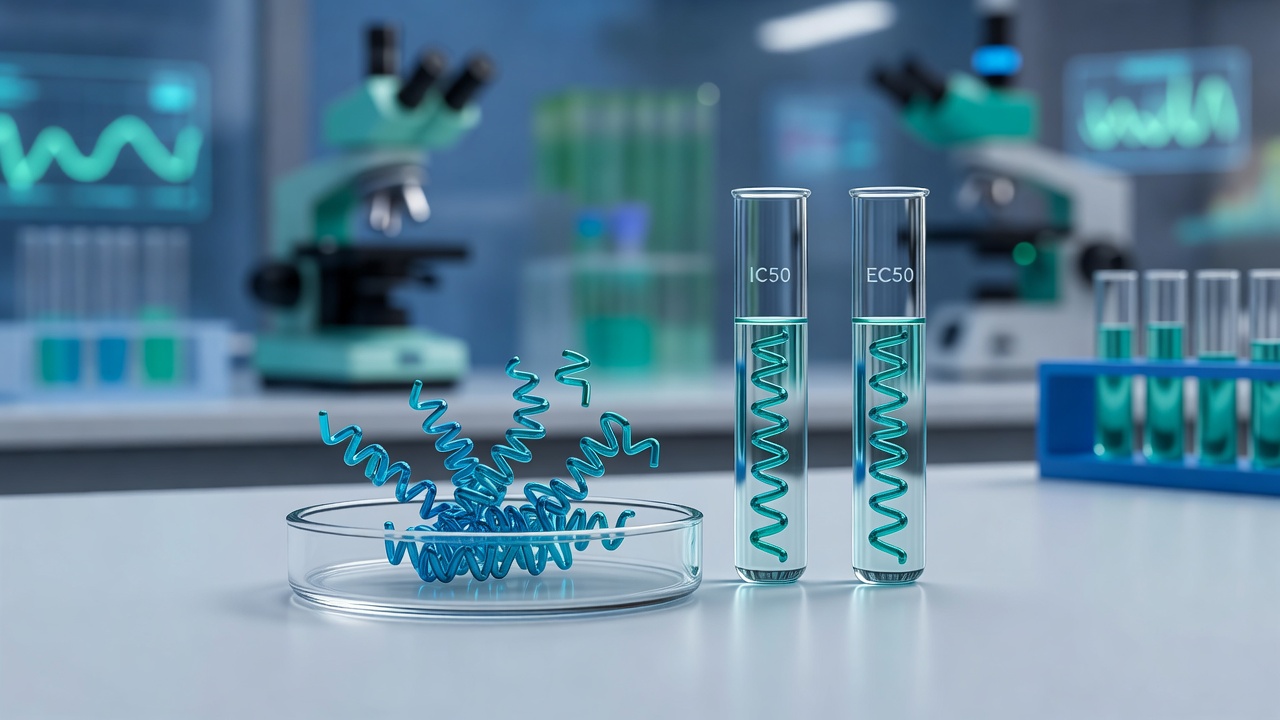
IC50 and EC50 both locate a midpoint on a concentration–effect curve, but they are not interchangeable peptide potency numbers. IC50 is the concentration that produces 50% inhibition of a defined process; EC50 is the concentration that produces 50% of a defined biological response. Peptide studies often report both because the assay, the endpoint, and the direction of the fitted curve can differ.
What the two midpoints actually measure
An IC50 is fitted to an inhibition curve: as peptide concentration rises, a signal such as enzyme activity, receptor binding, or fusion events falls. An EC50 is fitted to a response curve: as concentration rises, a measured effect—plaque reduction, suppression of infection, or another outcome the authors define as the effect—reaches half of its maximum. Mixing the labels without the assay name invites false ranking of analogues.
That split is explicit in published peptide work. In a 2 June 2021 Frontiers in pharmacology study, designed peptides competing at the MERS-CoV HR1–HR2 interface were scored with IC50 values of 0.25–2.3 µM in a spike-mediated cell–cell fusion assay, while peptide four was separately reported with an EC50 of 0.302 µM for inhibition of MERS-CoV plaque formation (Kandeel et al.). The numbers occupy a similar micromolar window, but they come from different readouts and are not a unit conversion.
Computational anticancer-peptide modeling treats the metrics as separate targets. A 30 July 2021 Journal of chemical information and modeling paper (xDeep-AcPEP) trained models to predict EC50, LC50, IC50, and LD50 against six tumor cell types (breast, colon, cervix, lung, skin, and prostate) as distinct tasks on the CancerPPD data set; multitask learning achieved better performance than conventional single-task models (Chen et al.). If the labels were aliases, a single output would have sufficed.
A 1 May 2021 Biomeditsinskaia khimiia screen of SARS-CoV-2 main-protease inhibitors shows the same split outside a peptide-ligand series. Inhibitory activity against the protease was measured with a synthetic fluorescently labeled peptide substrate and reported as IC50 in the submicromolar and micromolar ranges for eight compounds. Antiviral activity was tested separately against SARS-CoV-2 in Vero cell culture; three compounds suppressed replication at micromolar EC50 values and had low cytotoxicity (Sulimov et al.). Biochemical inhibition and cell-culture suppression were different experimental stages.
Why the same ligand can look more or less potent
Assay format and cellular versus biochemical setting move the midpoint. An 18 September 2015 AIDS research and human retroviruses short communication reports both metrics for DC-SIGN ligands and peptide triazoles. In surface plasmon resonance competition, dextran D66 and isomaltooligosaccharide D06 prevented soluble DC-SIGN binding to immobilized mannosylated BSA with IC50 values of 35.4 µM and 3.4 mM. The same compounds inhibited DC-SIGN-mediated HIV infection of B-THP-1/DC-SIGN cells with EC50 values of 8 µM (D66) and 48 mM (D06). Peptide triazoles HNG156, UM15, and K13 had infection EC50 values of 40 µM, 100 nM, and 25 nM; that abstract does not pair those peptides with SPR IC50 values (Pustylnikov et al.). For D66 the infection EC50 is numerically lower than the SPR IC50; for D06 it is higher. Neither pattern is a general conversion factor.
Illustrative laboratory example 1 (hypothetical; not taken from the papers above). A 12-residue fusion-mimetic peptide is titrated in two plates on the same day. Plate A is a biochemical competition assay (labeled HR2 peptide binding to immobilized HR1), fitted as percent inhibition versus log concentration, IC50 ≈ 80 nM. Plate B is a cell–cell fusion reporter in a different medium, serum, and incubation time, fitted as percent of maximum fusion suppression, EC50 ≈ 400 nM. The peptide did not “lose potency”; the curves answer different questions under different free-peptide, receptor, and kinetic conditions.
Illustrative laboratory example 2 (hypothetical). The same fusion-suppression wells are refit after 100% effect is defined as the no-peptide control rather than a saturating reference peptide, and the top concentration is dropped because of apparent cytotoxicity. The EC50 shifts even though the raw measurements are unchanged. A viability plate run in parallel would be a third midpoint, not a replicate of the inhibition or fusion curves.
Uncertainty is built into the fit. Midpoints inherit how 0% and 100% effect were defined, how concentrations were spaced, and whether cytotoxicity was checked in the same window. The MERS-CoV peptides were reported without cytotoxicity up to 10 µM, above the fusion IC50 range and the plaque EC50 for peptide four (Kandeel et al.), but that window does not make the two antiviral numbers equivalent. The SARS-CoV-2 screen found more compounds with protease IC50 values than with cell-culture EC50 values (Sulimov et al.): biochemical potency need not appear as a cellular response at a comparable concentration.
Decision table: which number to use
| Question you are answering | Prefer | Do not treat as equivalent |
|---|---|---|
| How well does the peptide block a defined molecular event (binding, proteolysis, fusion signal)? | IC50 from that inhibition assay | An EC50 from infection, plaques, or viability |
| At what concentration does a cellular effect reach half-maximum? | EC50 from that response assay | An IC50 from a biochemical or SPR competition curve |
| Can two peptides from different papers be ranked? | Only if assay, system, endpoint, and curve type match | Mixing IC50 with EC50, or fusion with plaque, enzyme, or infection |
| Does a model “predict potency”? | The specific label it was trained on (IC50 vs EC50 vs LC50 vs LD50) | One predicted number reused under another acronym |
Checklist before copying a peptide potency into a comparison table
- Name the process: inhibition of X versus effect Y.
- Record the model (cell–cell fusion, Vero culture, B-THP-1/DC-SIGN, SPR with mannosylated BSA, and so on).
- Keep units with the metric (nM versus µM versus mM).
- Note whether a cytotoxicity window was reported in the same study.
- If both IC50 and EC50 appear for one analogue, treat them as two results, not a replicate.
As of literature captured on 28 September 2026, the studies cited were published between 2015 and 2021 and describe cell-based, biochemical, or computational work; they do not supply a universal IC50-to-EC50 ratio for peptides. A remaining practical question is when a binding or protease IC50 should even be expected to predict a replication EC50 for a given chemotype—left open by the SARS-CoV-2 screen, in which only a subset of enzyme-active compounds showed micromolar cell-culture EC50 values.
Frequently Asked Questions
Can I convert a peptide IC50 into an EC50 with a fixed factor?
No conversion factor is supported by the cited studies. For D66, the infection EC50 (8 µM) was lower than the SPR IC50 (35.4 µM); for D06, the infection EC50 (48 mM) was higher than the SPR IC50 (3.4 mM).
Why does one peptide paper list both IC50 and EC50?
Because the authors ran more than one assay. Kandeel et al. reported fusion IC50 values and a separate plaque-formation EC50 for peptide four. The same pattern appears outside peptide ligands: Sulimov et al. reported protease IC50 values and cell-culture EC50 values as different experimental stages.
Explore Further
Browse our research peptide catalog and review third-party lab reports & COAs for published batches.
---
Research use only. The information above is provided for educational and laboratory research purposes only. The compounds discussed are not approved for human or veterinary use, diagnosis, treatment, or the prevention of any disease. Nothing here is medical advice.